 A statistical map is just like it sounds, it shows stats on a map. In this example the statistics are the percent change in metropolitan and micropolitan population in the U.S.
Monday, April 27, 2009
Statistical Map
A statistical map is just like it sounds, it shows stats on a map. In this example the statistics are the percent change in metropolitan and micropolitan population in the U.S.Cartographic Animation

Animation is the presentation of individual frames in a given order. This example shows the dates of independence in African states in chronological order, which is the most common form of cartographic animation.
Cartogram
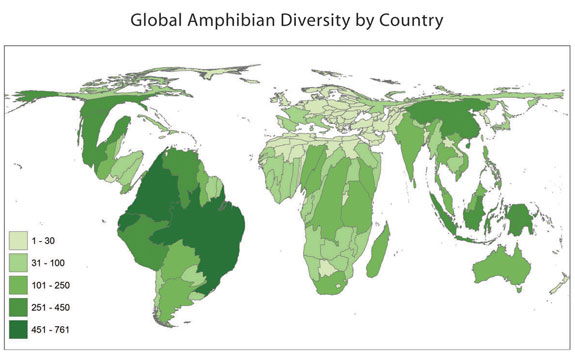 This is a cartogram showing the amphibian concentration in the world. It is definitely not a conventional map, as the countries look skewed, but the map still shows the data.
Isoline Maps

Isoline maps show a representation of a 3 dimensional model with only 2 dimensions. They very quickly communicate the distributions being examined, as with this example of forecast winds.
Hypsometric Contour Map

This is an example of a hypsometric map with contour lines. The information to be gathered at this stage includes cartographic, geological, geotechnical, hydrometeorologic, sedimentometric, environmental and cost data, of regional and local nature.
Nominal Area Choropleth Map
 This is a nominal area choropleth map. It shows political positions of different countries in Africa by using different colors.
Unstandardized Choropleth Map

This is an example of an unstandardized choropleth map. It shows acres of land usage for Hay, Haylage, Grass Silage, and Greenchop in the U.S. in 2002. It is not arielly averaged for each boundary.
Subscribe to:
Posts (Atom)